Nowadays, Colombia’s government dispose of a platform to check the public databases, this website calls datos.gov.co. Here, anyone can extract databases related to all public areas such as the information about ministries, superintendencies, and more government entities.
However, the manipulation and extraction of databases, sometimes, can be winding for the number of rows and columns. For that reason, the platform disposes of an API to connect different programs with the website and extract the information easily.
Database extraction and storage
Following on from the previous section, we will show you how to link this API to Python and then how to store the data in Google Big Query so you can easily create data visualizations in Google Data Studio.
First, We have to install the library sodapy.
1
! pip install sodapy
Later, we import the needed libraries for data manipulation. For this analysis, we have to take into account the results of the ICFES in the second semester in 2019.
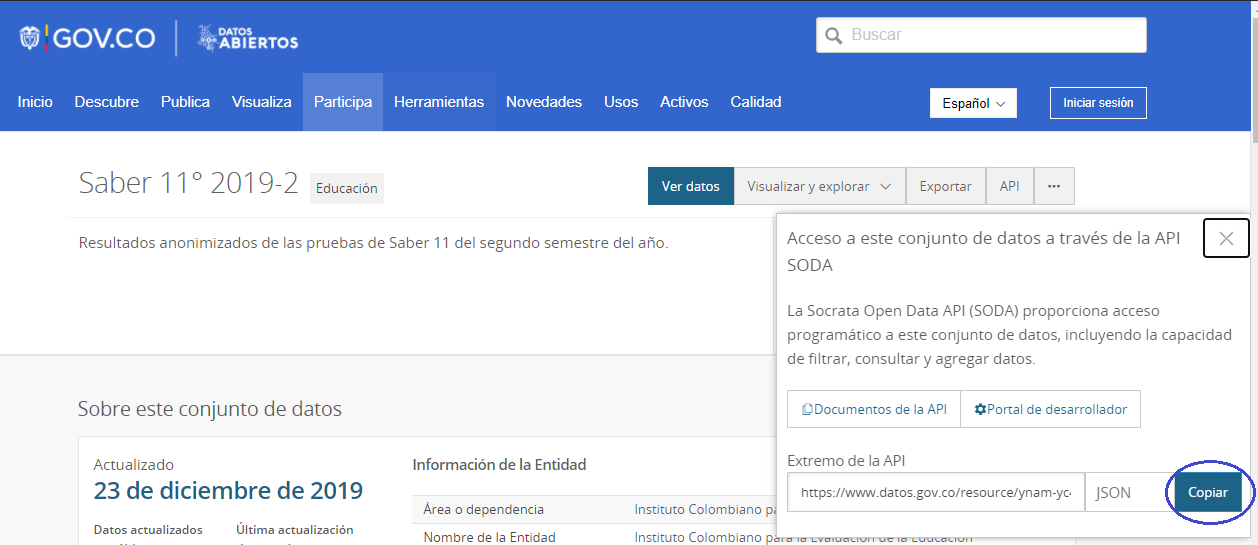
After we copy the last fragment of the path, in this case: ynam-yc42
The previous fragment identifies the database and we have to copy and paste it into the python code.
1
2
3
4
5
6
7
8
import pandas as pd
from sodapy import Socrata
client = Socrata("www.datos.gov.co", None)
# we have to specify the number of rows to import.
results = client.get("ynam-yc42", limit=546212)

# We have to convert the results into pandas Dataframe.
results_df = pd.DataFrame.from_records(results)
Once we store and manipulate the information in Python and Google Big Query, we can use this storage to make future data analyses.
1
results_df.to_gbq("table_name_global.table_name", "project_name", if_exists="replace", chunksize=80000)
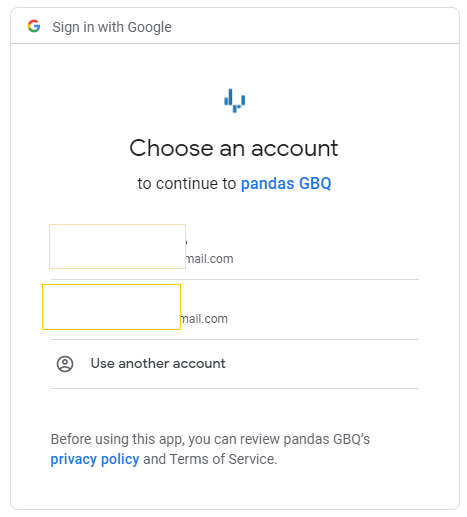
In this step, the program will ask access permission to the Gmail account because Google Big Query needs these permissions, as we show as follows:
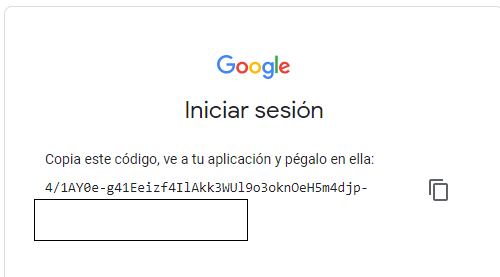
Finally, we copy and paste the token into the label.
Visualization
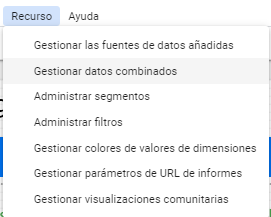
Base on the information stored in Google Big Query, we open the website Google Data Studio, a new project. There, we open the resources to import the databases:
Then, we select “Manage added data sources”. These are the options, and we have to choose Big Query.
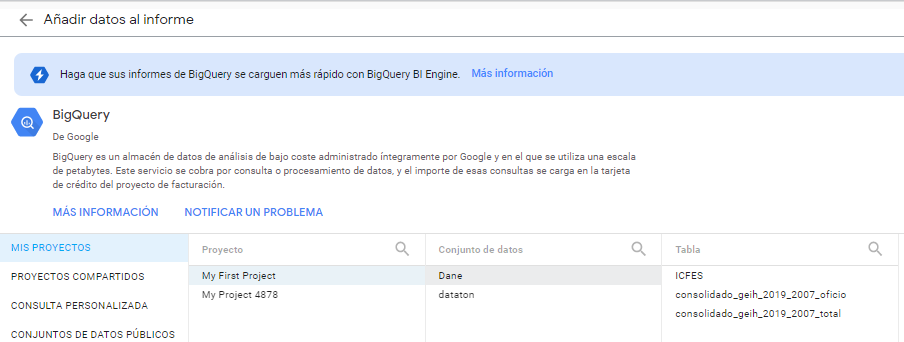
There, we choose the Big Query table by the project name and data set.
We make the graphs, the result is the following dashboard:
Analysis
- To clarify, this is a simple exploratory data analysis. The analysis does not imply causality. It just makes a hypothesis for future research.
- The majority of the people that presented the exam are 17 years old on average.
- There is a positive relationship between the number of books in the household and the average score in the exam. (This hypothesis can be proved with a hypothesis test)
- The students with the internet, on average, have better performance than the students without the internet.
- The worst category, on average, was English to the students in low levels of stratification. Instead, the English category was the best for the students in the high level of stratification.
- There is a number optime of people who may be in a household to get a better score in the ICFES (3-4 people), more than 9 people reflects in average a worse score than the people in the other categories.
- On average, the men’s schools are better than female and mixed schools.
- Seems to be a positive relationship between the mother’s education level and the performance of the student in the exam.
Future improves
- Analyze causality to show if the student’s score depends on the parents’ education level.
- Check whether the socioeconomics aspects in the household affect statistically the student performance.
- Make a data cleaning to improve the data performance and check the outlier.

