In the economy, there are different forms to measure the behavior of the economic agents, specifically in the goods and services demanded and supplied in the economy. One of the macroeconomic variables with the most importance is inflation. The inflation variable needs to be controlled to have a good economic performance.

Inflation is the generalized increase and sustained of the goods and services prices in an economy during a specific period. That means the purchasing power parity of each economic agent inflation, decrease, and for that reason, they can not acquire the same amount of goods and services as before, where everything keeps constant.
For this case, the DANE (Departamento Administrativo Nacional de Estadística) is in charge of calculating the inflation in Colombia with the use of the ponderation price index to a basket of goods. The measure of the index can be done in two ways, Laspeyres and Paasche index. The DANE uses a variant of the Laspeyres index because it allows an easy actualization of the basket of goods to the price tracking.

First, we import the needed libraries to compute the values and generate the graphs.
1
2
3
4
5
6
7
import pandas as pd
import numpy as np
pd.options.mode.chained_assignment = None
import matplotlib.pyplot as plt
%matplotlib inline
plt.rcParams['figure.figsize'] = (14, 8)
plt.style.use('ggplot')
With the IPC’s information based on 2018 extracted from the Banco de la Republica, later we generate a database that includes the annual variation of the IPC, i.e. the inflation.
\[\begin{aligned} Inflación_{t}=\vartriangle IPC_{t}=\frac{IPC_{t}-IPC_{t-1}}{IPC_{t}} \end{aligned}\]1
2
3
4
5
ipc=pd.read_excel("IPC_base2018.xlsx",0)
print(ipc)
ipc['variacion']=0.0
for i in range(len(ipc)-1):
ipc['variacion'][i+1]=(ipc['IPC'][i+1]-ipc['IPC'][i])/ipc['IPC'][i]
In this case, we suppose the next values:
- Initial value: $3’000.000
- Initial date (year): 2005
- Final date (year): 2019
1
2
3
año0=int(input("año inicial"))
añof=int(input("año final de referencia"))
valor0=int(input("valor a calcular"))
On the other hand, we generate the function to generate the computation base on the initial value of $3’000.000 in 2005 to prices of 2019, using the following formula:
\[\begin{aligned} ValorFuturo_{2019}=\frac{ValorInicial*IPC_{2019}}{IPC_{2005}} \end{aligned}\]1
2
3
4
5
6
7
8
9
10
11
12
13
14
15
16
17
18
19
20
21
22
23
24
25
def calculadora(valor0,t0, tf):
variacion=(ipc[ipc['Año']==tf]["IPC"].sum()-ipc[ipc['Año']==t0]["IPC"].sum())/ipc[ipc['Año']==t0]["IPC"].sum()*100
final=valor0/ipc[ipc['Año']==t0]["IPC"].sum()*ipc[ipc['Año']==tf]["IPC"].sum()
final=round(final,2)
base=pd.DataFrame([])
base['año']=range(t0,tf+1)
base.set_index(base['año'], inplace=True)
base['valor']=valor0
base['variacion']=0.0
for i in range(t0,tf+1):
base['valor'][i]=valor0/ipc[ipc['Año']==t0]["IPC"].sum()*ipc[ipc['Año']==i]["IPC"].sum()
base['variacion'][i]=ipc[ipc['Año']==i]["variacion"].sum()
print("El valor a %s es $%s"%(t0,valor0))
print("El valor a %s es $%s a precios de dicho este año"%(tf,final))
print("La inflación entre los años %s y %s es de %s"%(t0,tf, round(variacion,2))+"%")
print("Esto equivale a una inflación media anual de %s"%round(base['variacion'].mean()*100, 2)+"% "+"durante este período")
plt.plot(base['valor']);
plt.xlabel("Año")
plt.ylabel("Valor en el tiempo")
plt.title("Valor en el tiempo desde %s hasta %s"%(t0, tf))
for a,b in zip(base.año,base.valor):
plt.text(a, b, str(b))
plt.show()
return
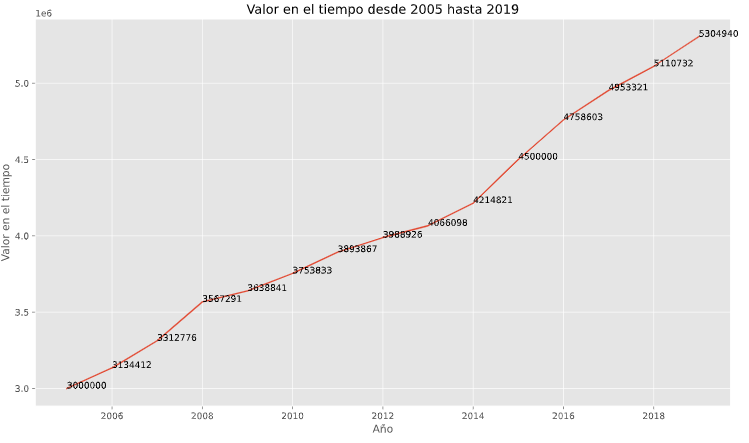
Finally, we run the code with a function that relates to the values mentioned in the previous section.
1
calculadora(valor0,año0, añof)
This is the result of the previous function, showing the values across the time in the reference period according to values selected in the calculator.
As a future project to complements this calculator, the reader can add a function that computes the future value to present value, i.e. compute current prices to past prices. For example, the same previous $3’000.000 in 2020’s prices to 2000’s prices.


